SERVICE
Data Analytics & AI
Turn raw data into strategic intelligence.
What is AI data analytics?
AI data analytics combines automated data pipelines with machine learning to go beyond reporting what happened. It cleans and joins data from your systems, forecasts what is likely to happen next, flags anomalies as they occur, and lets people ask questions in plain language instead of waiting for an analyst to build a report.
THE PROBLEM
Organizations sit on massive data but lack the tooling to extract insight. Decisions stay slow, reactive, and gut-driven.
OUR SOLUTION
We build analytics platforms with automated ETL, predictive models, natural-language querying, and live dashboards that turn your data into a competitive advantage.
HOW IT WORKS
How we turn raw data into decisions
- 01
Connect the sources
Automated ETL pulls data from your CRM, ERP, databases, and APIs into one clean model.
- 02
Clean and validate
Missing values, duplicates, outliers, and inconsistent formats are fixed automatically, with a report on what changed.
- 03
Model what matters
Forecasting, churn prediction, and anomaly detection built for the decisions you actually make.
- 04
Put it in front of people
Live dashboards and plain-language querying, so everyone can use the data, not only analysts.
- 05
Keep it accurate
Models are monitored and retrained as new data arrives.
TYPICAL STACK
- Python
- Pandas
- scikit-learn
- PostgreSQL
- ETL pipelines
- Dashboards
- LLM query interfaces
TIMELINE
A first dashboard with automated pipelines typically fits our 4 to 8 week range. Forecasting models depend on how much clean historical data exists.
Key features
- Custom real-time dashboards
- Predictive analytics and forecasting models
- Automated ETL pipelines and data cleaning
- Natural-language query interfaces
- Anomaly detection and trend alerts
Use cases
- Sales forecasting and revenue prediction
- Churn analysis and prevention
- Operational KPI monitoring
- Market and competitor analysis
Benefits
- Data-driven decisions 3x faster
- See trends before they happen
- 80% less time producing reports
- Hidden patterns surfaced automatically
COMPARE
Predictive analytics vs. traditional reporting
| Criterion | Predictive analytics | Traditional reporting |
|---|---|---|
| Question answered | What is likely to happen next? | What happened? |
| Timing | Live, with alerts | Weekly or monthly reports |
| Who can ask | Anyone, in plain language | Analysts who build the reports |
| Data preparation | Automated pipelines | Manual exports and spreadsheets |
RELATED WORK
Built in this discipline.
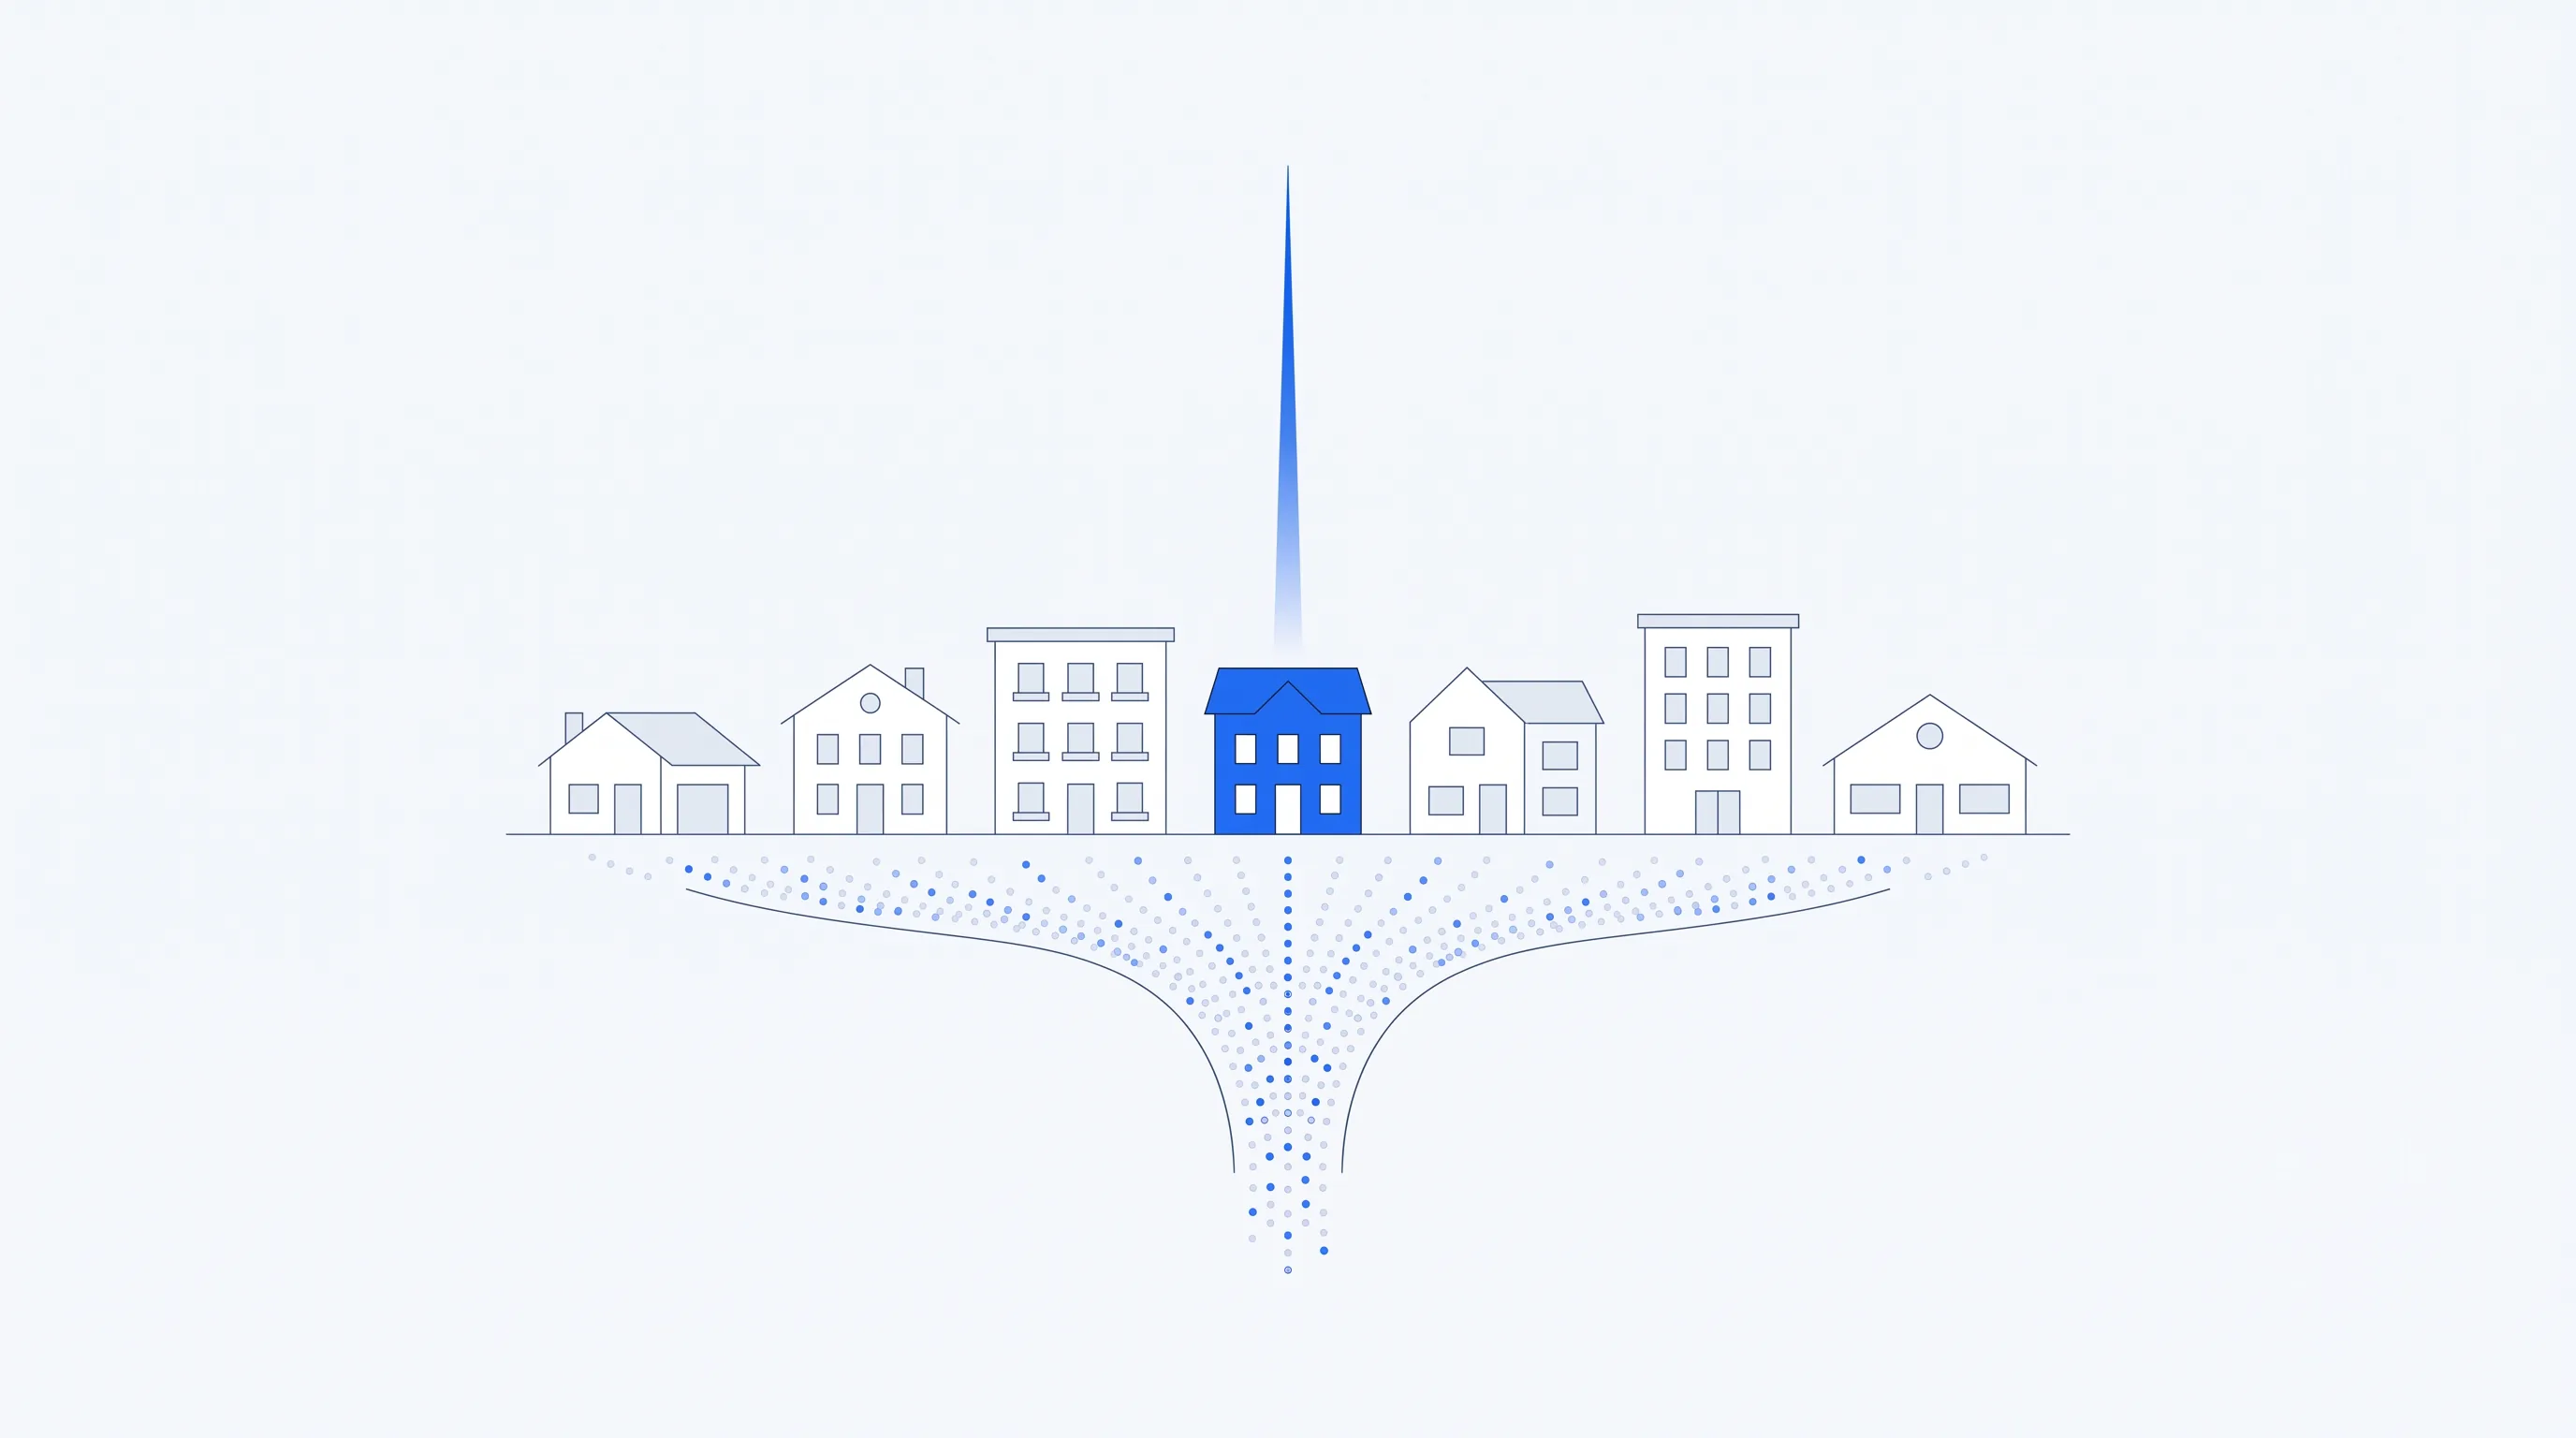
Real Estate Property Recommendation System
Complete ML pipeline that collects property listings, cleans data, and recommends properties based on budget, location, size, and commute time.
Case study
Intelligent Data Cleaning Pipeline
Automated system that uploads CSV files, fixes missing data, outliers, and inconsistent formatting with a hybrid ML system and generates detailed reports.
Case study
AI Health & Diet Recommendation System
Lifestyle guidance system where users enter health goals to receive AI-generated meal plans, ML-recommended calorie intake, and chatbot fitness advice.
Case studyINDUSTRIES
Industries we build this for.
FAQS
Data Analytics & AI: common questions
How much historical data do we need for forecasting?
Enough to cover the patterns you want to predict, which usually means at least one full seasonal cycle. We check the volume and quality of your data during discovery before committing to a forecast.
Can you work with messy data?
Yes. Cleaning is often the largest part of an analytics project, and we have built automated pipelines that fix missing values, types, duplicates, and outliers and report on every change.
What is plain-language querying?
It lets people ask questions of your data in everyday English, such as which regions missed target last month, and get an answer or chart back, with the underlying query shown so the result can be checked.
Will this replace our BI tool?
Not necessarily. We can feed clean data and model outputs into the tools your team already uses, or build custom dashboards where those tools fall short.
How do you know a forecast is any good?
We test it against historical data it was not trained on before launch, then against real outcomes after. Accuracy is tracked over time, and models are retrained when it drifts.
Discuss this project
Tell us what you're building. We'll show you exactly how we'd engineer it.
- Free 30-minute discovery call
- You own the code, models, and IP
- Working software every week